Knowing who is visiting your website, what pages they’re clicking, the paths they’re taking to get there, and generally what they’re doing on your site can be absolutely invaluable when fine tuning to turn your virtual reality into real money.
Today, we’re going to look at the most popular website analytics package out there in Google Analytics. We’ll do a step-by-step approach to help you understand the terminology, what it means, and finally what you should do about it.
We’re going to do a case study on the most visited site we have in our profile: StateFansNation.com
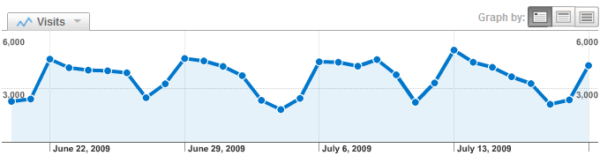
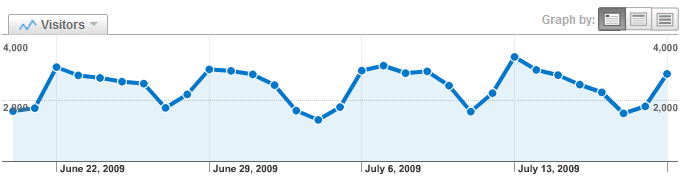
Visits
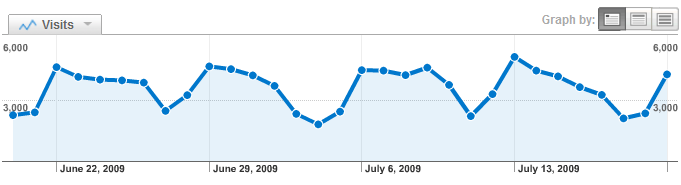
This graph shows us the number of unique visitors that hit statefansnation.com in the past month. A unique visitor counts only once per day and is a good count of the number of people who visited the site. Of course, this number does not a perfect 1:1 ratio of people to visits. A visit is technically defined as a “computer” and not a “person” therefore a person could be counted more than once on the visit scale. For example, a single person could be counted twice if he or she visited the site at work and then at home. Nonetheless, it’s a great indication of how voluminous your audience is. Over the course of this time period, statefansnation.com saw 111,892 visitors.
Pageviews
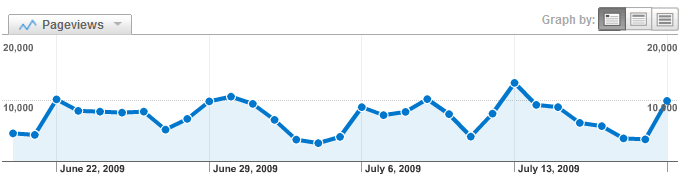
Pageviews are the number of times a single page was visited. Back in the hey days of the Internet, this was called “hits” and was used to gauge a popularity of a website. It’s a bit of a misleading stat because, technically, a single person could produce all of the pageviews in the graph. Therefore using pageviews as a popularity metric isn’t the right approach. Nonetheless, pageviews is a valuable metric. If, for instance, your visits graph looked exactly like your pageviews graph, that tells you that the quality of your website is not up to par with what the visitor is wanting. If that were the case, each visitor would have hit only one page and then left (more on this later) which segues nicely into our next metric.
Pages/Visit
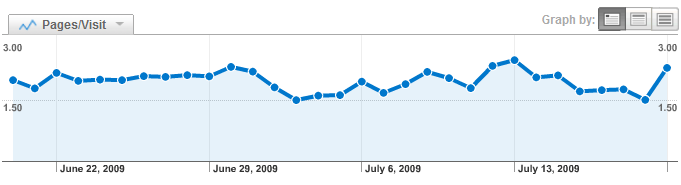
Using visits and pageviews together gives us a nice ratio. The graph shows us how many pages each visitor saw before exiting. This is another gauge into the relative success of your content. If you had a 7 or 8 pages/visit metric on your site, that tells us that visitors liked your site enough to click on 7 or 8 unique pages before exiting. Since statefansnation is a blog and many of the visitors are everyday users of the site, a 2.02 ratio isn’t all bad since the user will not be likely to click on previous entries that he or she may have already read.
Average Time on Site
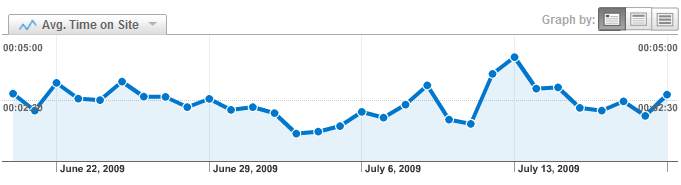
In addition to knowing how many pages a visitor saw, it is also important to know how long they spent to get a clear picture. If a person browses to your site, clicks a few links and exits within 30 seconds, your pages/visit metric may look misleadingly good. Putting that together with average time on site will normalize your visitors behavior. As we can see here, the average visitor spent 2 minutes, 31 seconds on the site before exiting. A “good” range will vary from industry to industry and site to site. However, anything below 30 seconds is certainly in the “bad” range.
Bounce Rate
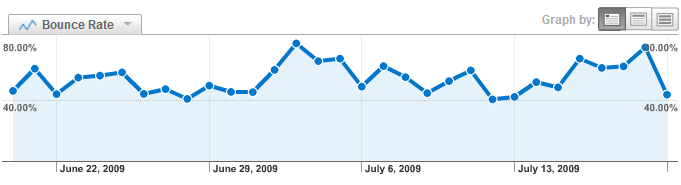
A bounce is defined as a visitor who did not offer a single click to your website. They came, they saw, they left. Again, translating this number into a tangible meaning will vary from site to site. Of course, the lower the bounce rate, the better. Here, statefansnation.com is seeing a bounce rate of 53.07%. Is this good? Probably so. Since it is a news site with newcomers only interested in the latest piece, it is quite typical for a visitor to land, read, and leave.
% New Visits
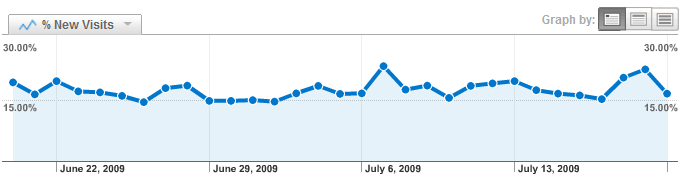
Knowing what percentage of your audience is “new” is important.
Absolute Unique Visitors
This report asks the question “has the visitor visited the site before outside of this date range?” If yes, they are categorized as a returning visitor and if not, a new visitor. Both are counted as an absolute unique visitor.
All Traffic Sources
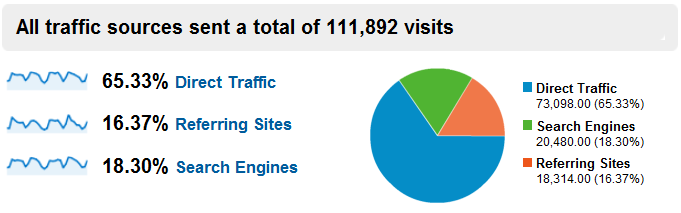
Now that we know generally “who” your active audience is, it’s important now to know how they got to your site. This overview graph lets us know that 65% of the time, visitors are the result of direct traffic, or someone manually types the address in (or selects it from a bookmark) to get to the site. 16% of the time, they are referred, or sent to the site from a link somewhere else on the Internet. And 18% of the time, they are the result of appearing on a search listing.
These three measures are important independent of each other, but one may be more important depending on your method of advertising.
There’s far more to what you can do with these metrics, especially determining what keywords yield the most quality visits, which sites are heavy referrals, and which search engines your site is performing best on. All of these metrics are available inside of Google Analytics.