Data tell a story. Sometimes, you can draw incomplete or incorrect conclusions by analyzing the wrong piece of data, telling a vastly different story. In the digital age, there’s no lack of data, and free tools like Google Analytics give you an in-depth look at your website and its visitors. However, you must look first internally before drawing conclusions.
Data tell you a lot but sometimes it can only tell you so much. The story the absence of data tells can be incredibly useful, if not more meaningful. Although it takes a great amount of discipline and an ability to think outside the norm, examining gaps in data can light a path that leads to success.
A Primer on Survivorship Bias
Survivorship Bias is a logical error that only accounts for results that survive a process. This type of selection bias can ultimately lead to incorrect or incomplete conclusions by only considering a remaining data set after a process has been completed. It can be the result of an anchoring fallacy, which is the very real human tendency to put too much credence on the first piece of information that comes to hand and ignore the rest. Survivorship bias isn’t necessarily a direct result of an anchoring fallacy, but it often is.
To help you understand survivorship bias, I’ll apply it to a subjective matter: art. One could conclude that Renaissance art is better than modern art. The works of Michaelangelo are indeed magnificent – and almost universally accepted as so. It is not terribly common to hear someone critique the Sistine Chapel or the statue of David. But, can one conclude that Renaissance era art is indeed superior to the modern art model? Well, since it’s a subjective matter, sure, you could certainly make that claim and not be wrong. But, are you looking at the whole picture?
Evaluating Renaissance era art is a classic example of survivorship bias. What we see today that represents that era has survived 400 years of critique, war, and natural disaster. It is reasonable to assume that we see is indeed the finest of the era. The not-so-good pieces of Renaissance art may have been forgotten by time.
On the contrary, modern art has not yet been weeded out of its weakest elements. I imagine with some time, modern art will be evaluated only after the finest survive. Comparing Renaissance art and modern art is indeed like comparing apples and oranges.
Real World Applications of Survivorship Bias
Survivorship bias has an important role in finance, architecture, manufacturing, and the military to name a few. In one of the most poignant examples of survivorship bias comes via World War II statistician Abraham Wald who used survivorship bias when considering how to minimize naval aircraft losses.
The Center for Naval Analyses conducted research analyzing a series of aircraft and the damage they sustained during combat missions. Damage was indicated with a red dot on a diagram and the researchers recommended body hardening those areas.
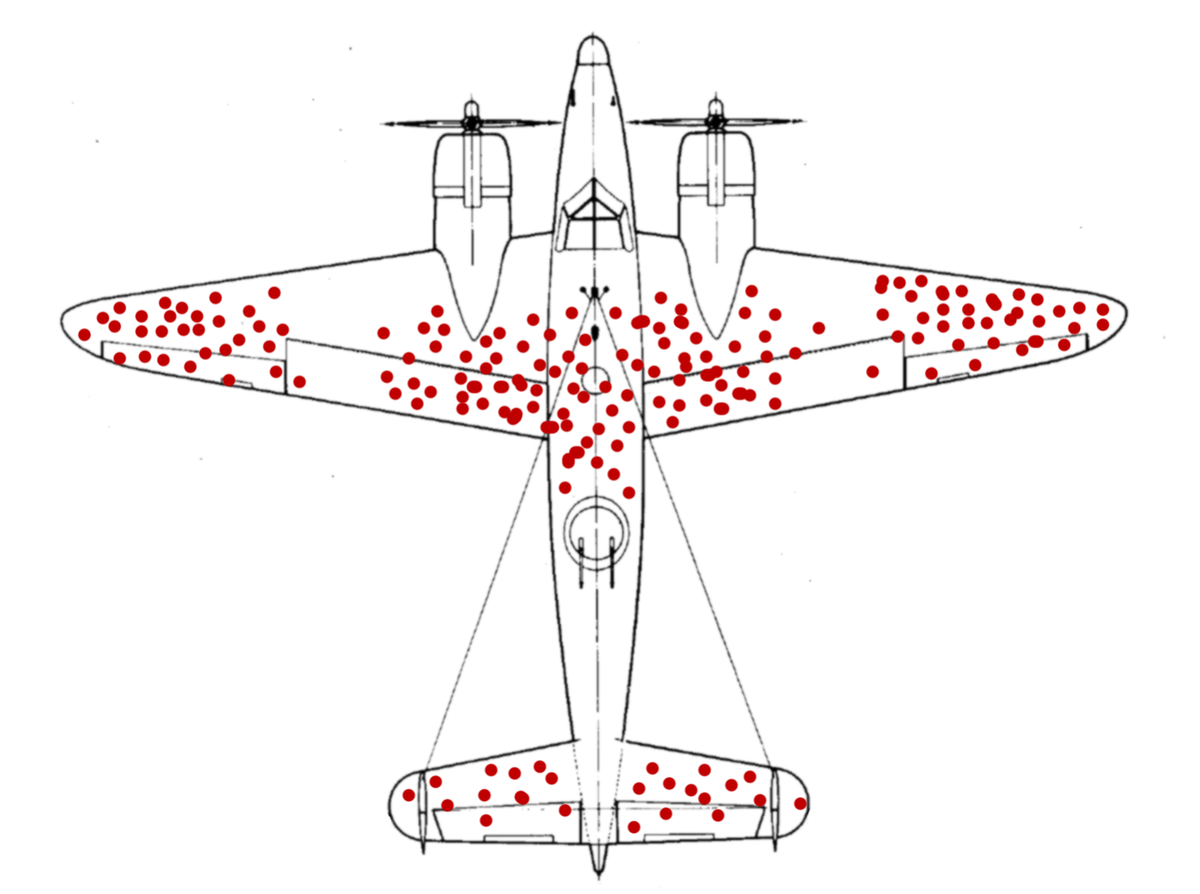
However, the damaged areas indicated on the diagram only indicated where an aircraft could sustain damage and still return safely. What was not a subject of research were the planes resting on the bottom of the Pacific Ocean. Wald claimed that the research was therefore inconclusive and that hardening the red dotted areas of only those plans that “survived” would be misguided. Instead, Wald claimed, resources should be spent investigating and hardening the areas where aircraft sustained damage and didn’t return home.
Survivorship Bias in Digital Media
Often not life-or-death situations, the volume of data exposed to a marketer is impressive – although perhaps incomplete. The most potent example of survivorship bias in digital media is a conversion rate since it very clearly represents an endpoint to a successful process.
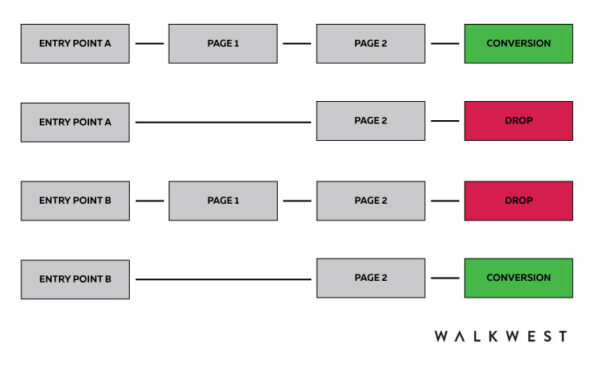
Take the following, simplified scenario for example.
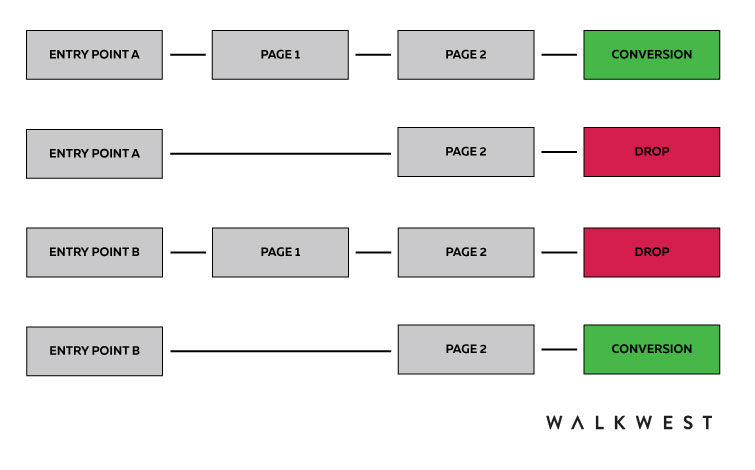
This scenario illustrates two entry points into a website, Entry Point A and Entry Point B and a very short path to either conversion or drop represented by navigation to either Page 1 or Page 2. Anchoring fallacy could cause one to believe that either Entry Point A is better than Entry Point B if Entry Point A’s conversion rate is 7% as opposed to Entry Point B’s 3%. And that may not be a wrong conclusion. But it’s backed by incomplete analysis.
What we see is that Entry Point A requires an extra step to conversion where as Entry Point B does not. In fact, if a user entering Entry Point B hits Page 1, they drop. Perhaps the users in Entry Point A needed a bit more validation before converting and, when not provided that additional validation, they drop.
A user who enters at Entry Point B could represent a user who is lower in the marketing funnel than a user entering in Entry Point A. Too much information to this user could lead to a drop due to a high friction process (Page 1 then Page 2 as opposed to just Page 2). That’s natural for users who are lower in the funnel than those at the top.
A more poignant conclusion to draw from here is not that Entry Point A is better than Entry Point B, but that the type of user could be completely different – a conclusion that could have lasting results in a marketing campaign.
Conversions rates represent the most classic example of survivorship bias in digital marketing. When evaluating successful conversion paths, you’re not considering the (likely) larger audience who did not convert. This isn’t to suggest you shouldn’t pay close attention to what’s working, but it’s equally important to understand what’s not working. Drop off areas, bounce rates, and other negative factors can help you understand where along a path that needs to be improved.
Conclusions
While powerful data points that hit you upon first glance should never be ignored, you’ll find a more thorough analysis of your traffic data by examining faults in process. Instead of centering on the sexiest piece of data (anchoring fallacy), try going deeper to find out why fatalities along the process to conversion exist. See if there’s any meaningful information that could support a reason why. Keep in mind that your data will not tell you this answer, but it’s the analysis of data coupled with your insight into your company and industry that will create those answers.